Sales Tax Report

January 02, 2026
The IT Retail Sales Tax Report shows your store's data on everything tax-related. You can view information like the total dollar amount of your store's taxable sales, departments with taxes attached, and the total tax charged. You can find this information for each tax rate you've made. To learn how to add tax rates in the Back End, read our article linked in the Related Articles section on Taxes. Keep reading to see everything the Sales Tax Report can do for you, so you can make more informed tax-related decisions.
Sales Tax Report
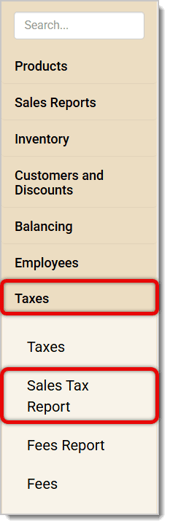
In the Back End main menu, go to Taxes > Sales Tax Report.
Here is how to use this page:
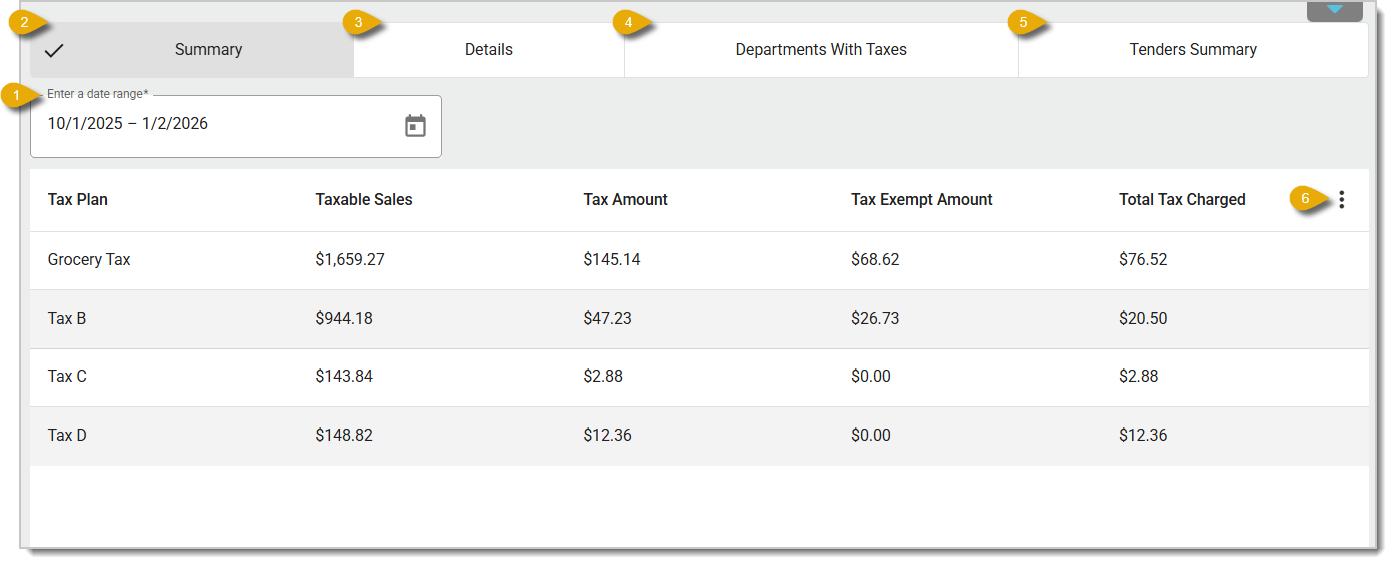
- Date Range — Enter the Date Range of the data you want to view. By default, the report will show data for the current month.
- Summary — When you open your Sales Tax Report, you'll automatically view a Summary of it, as in the image above. If you change views, you can click on the Summary tab to view the summarized data again. In this section, you'll find a table of each tax plan's data for:
- Taxable Sales — This is the total dollar amount of sales that were taxable.
- Tax Amount — This is the total amount taxed from the taxable sales
- Tax Exempt Amount — This is the total dollar amount that was not taxed due to exemptions.
- Total Tax — This is the total amount of tax that was actually charged; this amount is calculated by Tax Amount minus Tax Exempt Amount
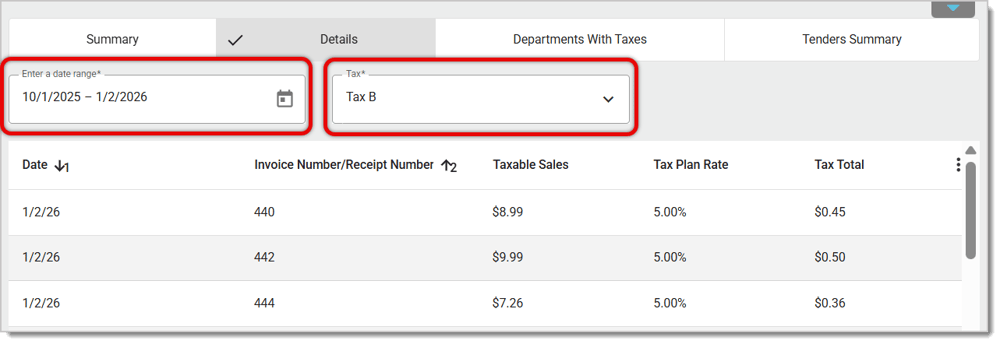
- Details — Click on the Details tab to look deeper into every transaction's tax details. Select the Date Range and the Tax above the table for specific data.
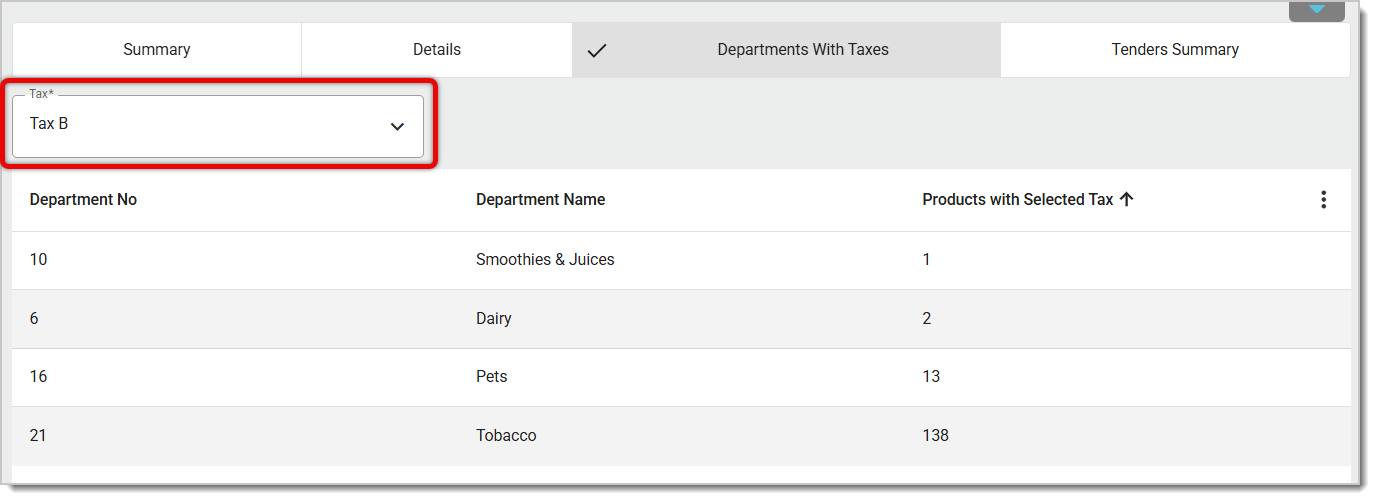
- Departments with Taxes — Click on this tab to view the Departments that have taxed products. Start by selecting the Tax from the drop-list above the table. You'll see the tax's data for the Department Number, Department Name, and Products with Selected Tax.
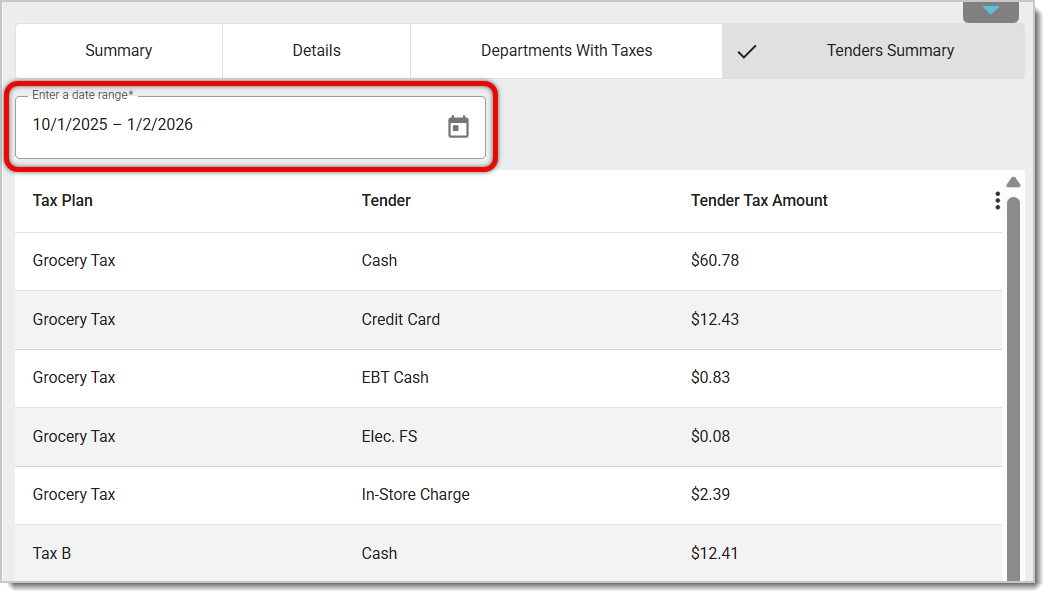
- Tenders Summary — Click this tab for tax plan data organized by Tender Types. Change the Date Range using the field above the table. You’ll see rows for each combination of Tax Plan and Tender, and the Tender Tax Amount charged for the combination in the Date Range.
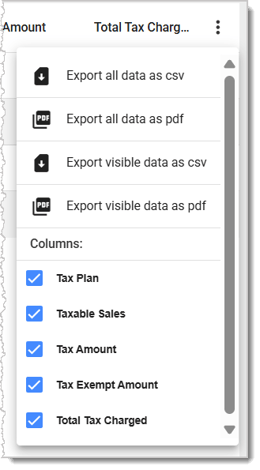
- Action Menu — For each of the Sales Tax Report’s tabs, you can click on the Three-Dot Stack icon on the far right to open the Action Menu for the tab. You can export your data as either a CSV file or a PDF file. You can also select which columns to show or hide. If you've hidden some columns, you're able to export all of the data, even if it's hidden, or only the visible data.
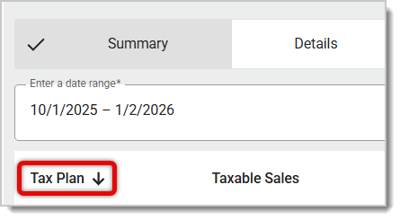
You can click on the name of any column to sort data according to that column, and click again to reverse the sort. An up arrow will indicate the data is in ascending order. A downward arrow, like in the below image, indicates descending order.
Related Articles
Taxes
How to Disable Tax for a Customer
Fee Report
Fees
Fees for Products
Frequently Asked Questions
Q: I have a question, but I can't find my answer here. How do I get more assistance?
A: If you need immediate assistance, the IT Retail team is available 24/7. Feel free to contact our support team at 877-752-0625. You can also email us at support@marktpos.com, and we will respond within 24 hours.
The IT Retail system makes it easy to add or update your products in the Back End. This article deta
If your store attaches fees to certain products, like CRV fees for plastic packaging, you can view t
Depending on your state laws, certain products may have required fees. For example, items with plast








Is this page helpful?
×Help us improve our articles