Product Movement

December 10, 2025
The Product Movement report shows how a specific item has performed and compares it to its sales from previous weeks or years. Use this report to get a visualization of a product's performance so you can make better-informed decisions. Read on to learn more about the Product Movement report and what it can do for you.
Product Movement Report
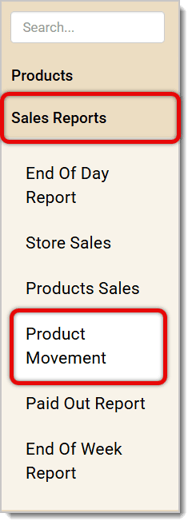
From the IT Retail Back End, go to Sales Reports > Product Movement.
On the Product Movement page, you can enter a product and set other filters. Here's everything you can use to change how you're viewing the data:
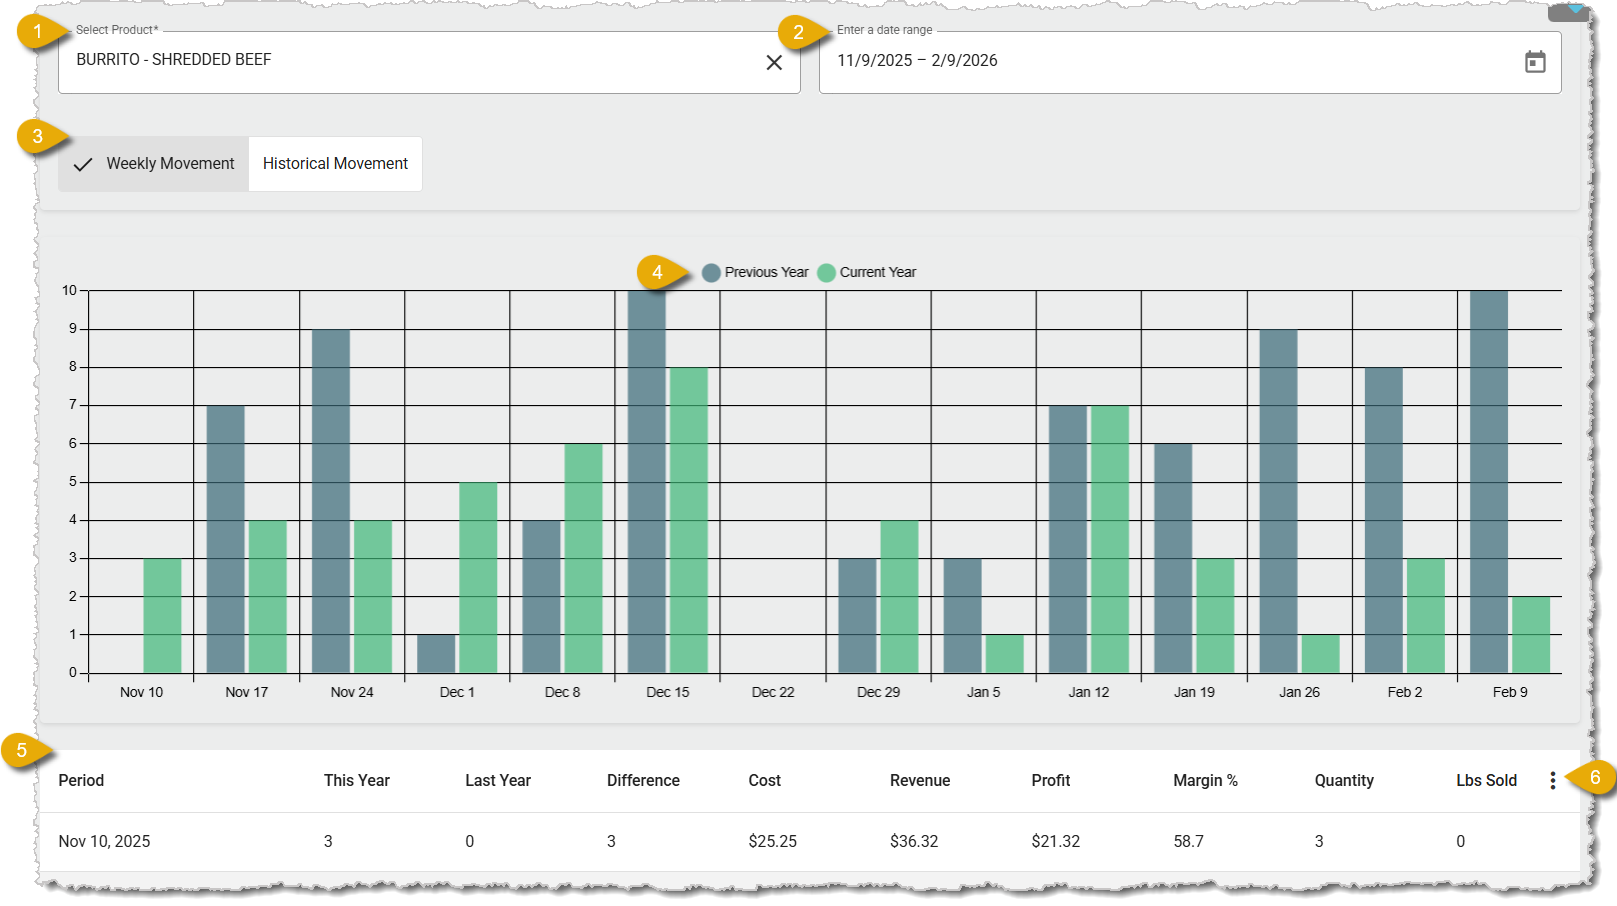
- Select a Product — Find the product by entering its UPC or Description. This field will give you a drop-list of items that match your entry. Click on the one you want to view.
- Enter a Date Range — Enter the Date Range you want the report to show.
- Weekly Movement / Historical Movement — The report will show you Weekly Movement by default, which will show day-by-day sales in a week. Click on Historical Movement to view the data according to month-by-month sales.
- Previous Year / Current Year — Data on the bar graph will be separated by the previous year and current year's sales. You can find the color code key directly above the bar graph.
- Sales Details — You can find details of each time period in the table below the graph. The time periods in this table will depend on whether or not you're viewing Weekly Movement or Historical Movement (from #3 above). Weekly Movement will show weekly data, while Historical Movement will show monthly data. The columns in this table include:
- Period — The time period (weekly or monthly basis).
- This Year — Total item sales from the current year for the period.
- Last Year — Total item sales from the previous year for the period.
- Difference — The current year's item sales minus the previous year's sales.
- Cost — How much your store pays for the item.
- Revenue — The total dollar amount earned for the item during the period.
- Profit — Your dollar amount earnings after all deductions and costs.
- Margin Percentage — Profit margin, in percentage points.
- Quantity — How many units of the item your store sold in the period.
- Pounds (lbs) Sold — How many pounds of the item your store sold; this is for items priced by weight.
- Action Menu — Click on the Three-Dot Stack icon to export your data and select which columns you want visible. You can choose to download all data or just visible data as a CSV or PDF file. Checkmarks denote what columns are visible.
Related Articles
Back End Dashboard
Store Sales
Product Sales
The End of Day Report
End of Week Report
End of Day Fields and Calculations
Frequently Asked Questions
Q: I have a question, but I can't find my answer here. How do I get more assistance?
A: If you need immediate assistance, the IT Retail team is available 24/7. Feel free to contact our support team at 877-752-0625. You can also email us at support@marktpos.com, and we will respond within 24 hours.
The first thing you'll see when you open the IT Retail Back End is the Dashboard. Here, you can see
Keep track of your store's overall sales by working with your Store Sales report in the Back End. Th
The Product Sales report from the IT Retail system's Back End breaks down your store's product sales








Is this page helpful?
×Help us improve our articles