







Cashier Training
Welcome to IT Retail, we’re so glad you’ve chosen our POS for your store! This article will guide yo
 December 09, 2025
The first thing you'll see when you open the IT Retail Back End is the Dashboard. Here, you can see an overview of the day's sales. This article will show you what each area of the Dashboard does for you. Take a look at what’s here for you!
If you want to reach the Dashboard again from another page, click on the IT Retail logo in the upper left-hand corner of the page. Below, we'll walk through each area you'll see on the Dashboard.
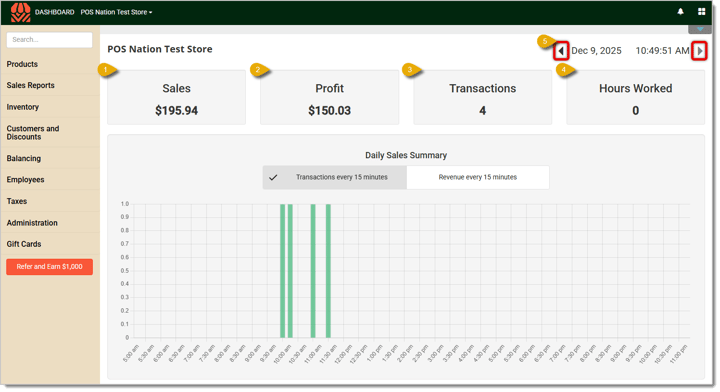
Data in your Dashboard refreshes approximately every 15 minutes.
Below your basic metrics, you can also find a bar chart for your Daily Sales Summary, where you can initially see the number of transactions you’ve had throughout the day. You can toggle between Transactions Every 15 Minutes and Revenue Every 15 Minutes, which will switch the chart to show dollar amounts you’ve sold throughout the day.
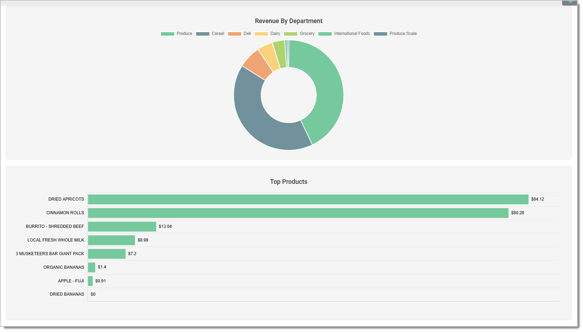
If you scroll down more, you'll find a donut chart visualizing the share of Revenue by Department and a bar chart showing sales totals for your Top Products.
End of Day Fields and Calculations
Q: I have a question, but I can't find my answer here. How do I get more assistance?
A: If you need immediate assistance, the IT Retail team is available 24/7. Feel free to contact our support team at 877-752-0625. You can also email us at support@marktpos.com, and we will respond within 24 hours.
Is this page helpful?
×Help us improve our articles