Product Sales

December 10, 2025
The Product Sales report from the IT Retail system's Back End breaks down your store's product sales according to Vendors and Departments. Use this information to keep track of what is and isn't selling well. Read on to see what insights you can get from this report!
Product Sales
From the Back End main menu, go to Sales Reports > Products Sales.
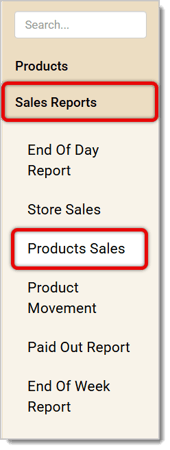
Once you've opened the Products Sales page, you can sort and filter entries by Date, Departments, Vendor, and more. Below are full details on the filters and sorting functions.

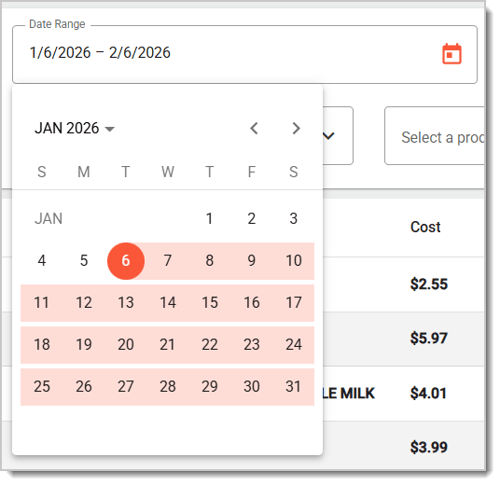
- Date Range — Select the range of dates you want. By default, you'll see product sales for the current day.
- Department — If you want to view your sales information for a Department, select the one you want from this drop-list.
- Section — Narrow down your results by selecting a Section from the drop-list. This is different from Departments. Sections are areas within a Department. For example, the Canned Goods Department can have different Sections for canned veggies and canned soups.
- Vendor — If you want to view your sales information for a Vendor, select the one you want from this drop-list.
- Product Group — Select a Product Group from the drop-list to narrow down your results.
- Search Product — Find sales information on a specific product by entering keywords from its Description in this field.
- Show Movers / Show Non-Movers — This page will Show Movers by default. Movers are products that have been sold throughout your selected date range. Click on Show Non-Movers to view products that did not sell at all throughout the date range.
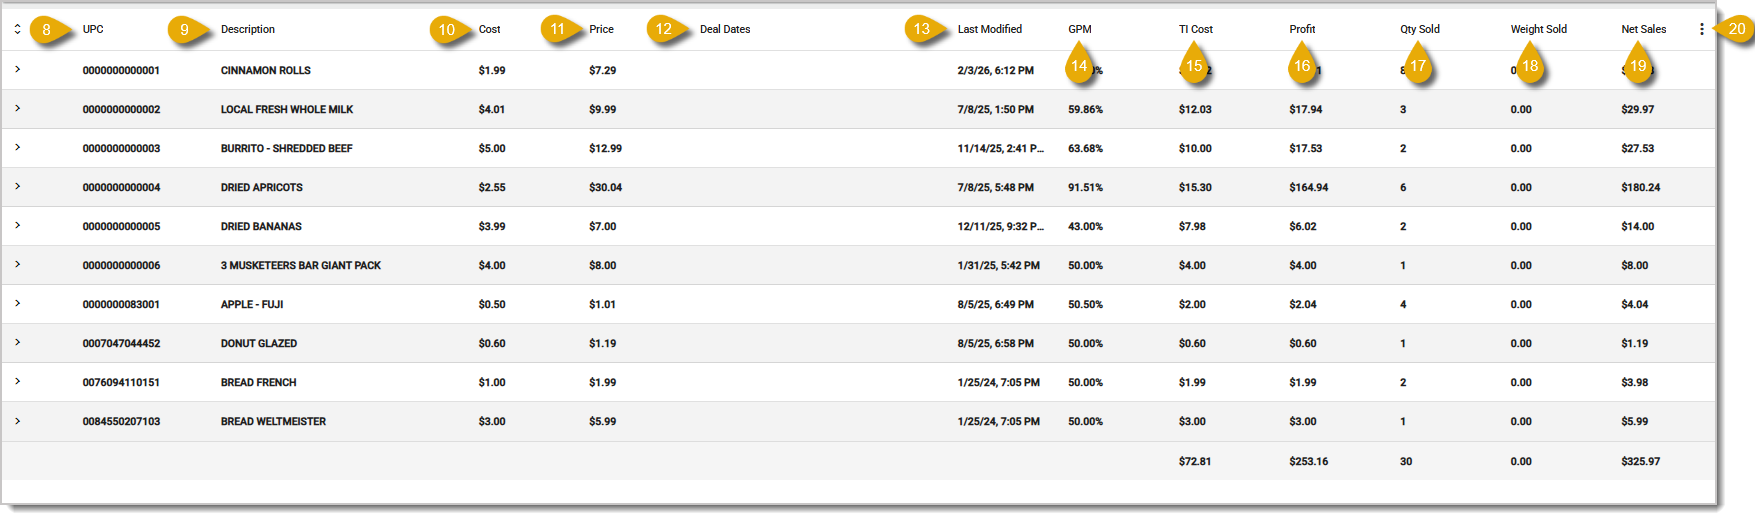
- UPC — This column lists every item's UPC.
- Description — This column lists every item's Description, which you set in the Product Maintenance area of the Back End.
- Cost — In this column you'll see how much you paid for each item.
- Price — In this column you'll find the Price that your customers pay for each item.
- Deal Date — If the item had Special Pricing during the date range you chose, those dates will be listed in this column.
- Last Modified — This column shows the date and time each item had its details last updated.
- Gross Profit Margin (GPM) — This column shows a value that's calculated by subtracting Cost of Goods Sold from Total Revenue, then dividing the result by Total Revenue for the specified date range. The values here are displayed as percentage points.
- TI Cost — TI Cost is the total for Tenant Improvement fees that are charged by commercial property leasing companies for improvements to the property.
- Profit — This column shows how much profit each item earned within the specified date range. The value is in dollar amounts.
- Quantity Sold — This column shows the total quantity of each item that was sold in the date range.
- Weight Sold — For items sold by weight, this column will give you the total weight of each item that was sold in the date range.
- Net Sales — The Net Sales column will show the item's total dollar amount sold within the time period.
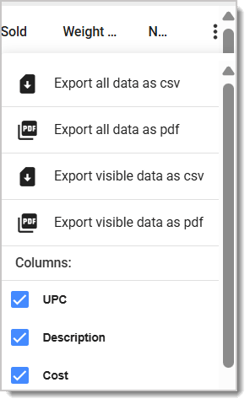
- Action Menu — To open the Action Menu, click on the Three-Dot Stack icon on the far right. In the menu, you can choose to export all or only visible data (if you've chosen to hide some columns), and choose between a CSV or PDF file. You can also hide columns or make them visible. Visible columns will have a checked box.
💡Pro Tip: You can organize your data by sorting the table. Click on any column header, such as UPC, to sort your entries according to that column. Click once for ascending order, and twice for descending order. An arrow next to the column title will indicate ascending (arrow facing up) or descending (arrow facing down) order.
Product Sales From the Last 30 Days
From here, you can also set up your sales report to show what products sold in the past 30 days. To do so, first adjust your date range to cover the last 30 days or another date range of your choosing.
We recommend then sorting your entries by Net Sales, which should be the furthest right column of your table.
Related Articles
Store Sales
Back End Dashboard
The End of Day Report
End of Week Report
Discount Sales
Frequently Asked Questions
Q: I have a question, but I can't find my answer here. How do I get more assistance?
A: If you need immediate assistance, the IT Retail team is available 24/7. Feel free to contact our support team at 877-752-0625. You can also email us at support@marktpos.com, and we will respond within 24 hours.
The first thing you'll see when you open the IT Retail Back End is the Dashboard. Here, you can see
Keep track of your store's overall sales by working with your Store Sales report in the Back End. Th
The Product Movement report shows how a specific item has performed and compares it to its sales fro








Is this page helpful?
×Help us improve our articles