Discount Sales

December 18, 2025
Interested in seeing how much you're 'giving away' in discounts? This article shows you how to generate your Discount Sales Report and how to work with it. Take a look at what it can do for you!
Generate Your Discount Sales Report
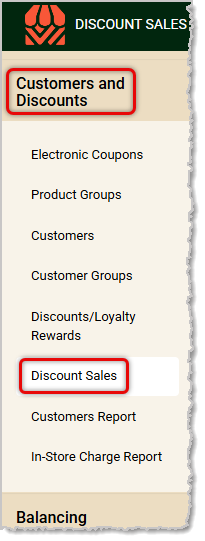
From the Back End, open the Customers and Discounts menu and click on Discount Sales.
Here is how to work with your Discount Sales Report:
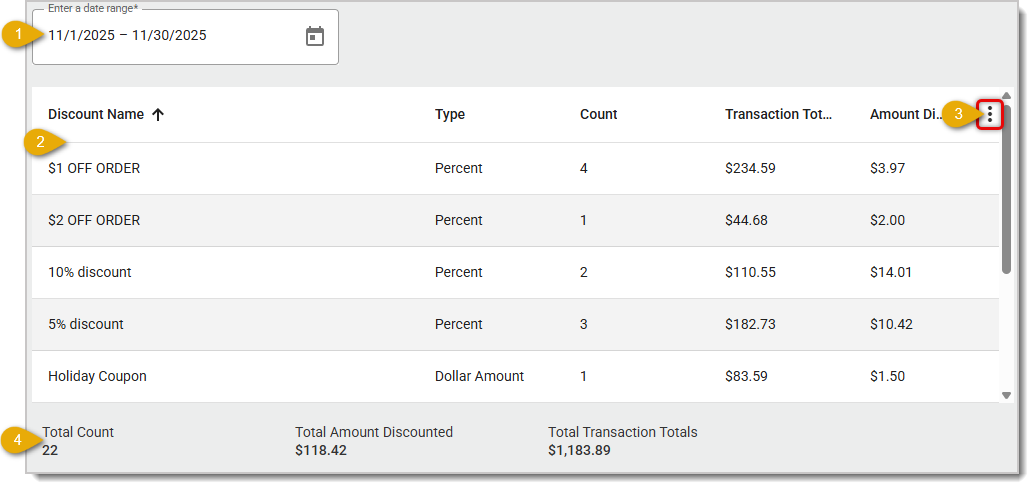
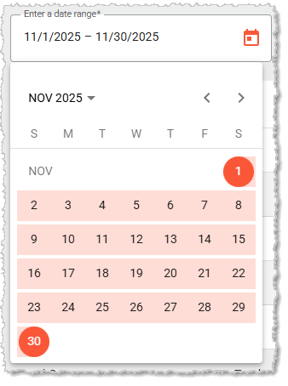
- Date Range — By default, the date will be set to the current month. If you need a different range of dates, you can click in the field and use the date picker to set From and To dates, as pictured below.
- Data Table — The Data Table for the Discount Sales Report shows each Discount Name, the Type of discount (Percent or Dollar Amount off), the Count for each discount, the Transaction Totals for those sales, and the total Amount Discounted using each discount within the selected Date Range. You can click the column header titles to sort the rows alphanumerically, and click again to reverse-sort. The system will provide an arrow to indicate how the report is sorted by that column.
- Action Menu — Click this Three-Dot Stack button to open the Action Menu for the table. This area offers you export options and lets you choose data column visibility. Here are your options:
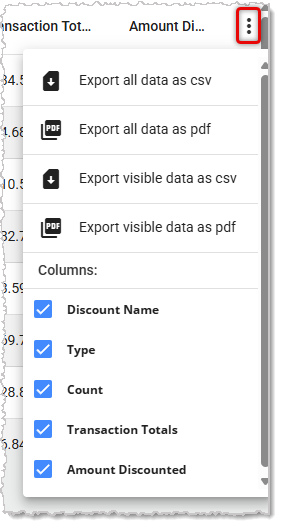
- Export All Data as a CSV — This will include all columns in the table. CSV files can be universally used in all spreadsheet programs, such as Excel or Google Sheets.
- Export Visible Data as a CSV — This will include only the data for the visible columns.
- Export All Data as a PDF — This will create a PDF file with all data in the table. Adobe Acrobat PDF files are the best means for documenting reports.
- Export Visible Data as a PDF — This will create a PDF file using only the data for the visible columns.
- Columns — By default, all columns will be active (checkmarked), but you can also un-check any columns you don't need.
- Totals — The totals for the data table for the date range are calculated here. They include the Total Count of discounts, Total Amount Discounted, and the sum of all Transaction Totals for all the discounts.
We recommend that you keep monthly exports of this report for your records.
Related Articles
Back End Dashboard
The End of Day Report
End of Week Report
Store Sales
Product Sales
Frequently Asked Questions
Q: I have a question, but I can't find my answer here. How do I get more assistance?
A: If you need immediate assistance, the IT Retail team is available 24/7. Feel free to contact our support team at 877-752-0625. You can also email us at support@marktpos.com, and we will respond within 24 hours.
If a customer wants to sign up for your store’s membership program, you can add them in the Front En
For businesses that charge for annual customer memberships, you can set expiration dates so you don’
You can set your customers to be able to charge items to an in-store account if you like. This artic








Is this page helpful?
×Help us improve our articles